


|
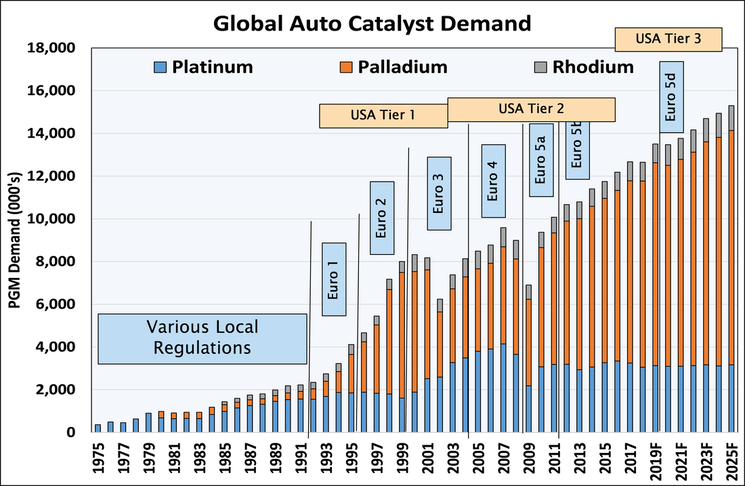
A Brief Emission Control Systems Background: Platinum Group Metals (PGM’s), specifically Palladium, Platinum, and Rhodium are essential ingredients to today’s three-way auto catalyst emission control systems. They enable significant reductions in Carbon Monoxides (CO2), Hydrocarbons (HC), Particulate Matter (PM), Sulfur Oxides (SOX) and Nitrogen Oxides (NOX) into the environment. All of these are primary contributors to air pollutions. Lead efforts to reduce automobile emissions started in the early 1960’s. Then in the 1975 vehicle model year, new emissions standards, as well as the increase in fuel usage, forced the invention of the catalytic converter after-treatment of the exhaust gas. This is when PGM global demand really took off. Mining in S. Africa expanded to meet this emerging demand.
The regional scope of these vehicle emissions standards have grown both geographically, and to ever tightening specifications ever since. Most recently, China has adopted widespread significant standards on par with the most stringent global standards of those used today in Europe. India is working to tighten its standards too, in an attempt to combat some of the world’s worst air pollution surrounding its population centers. 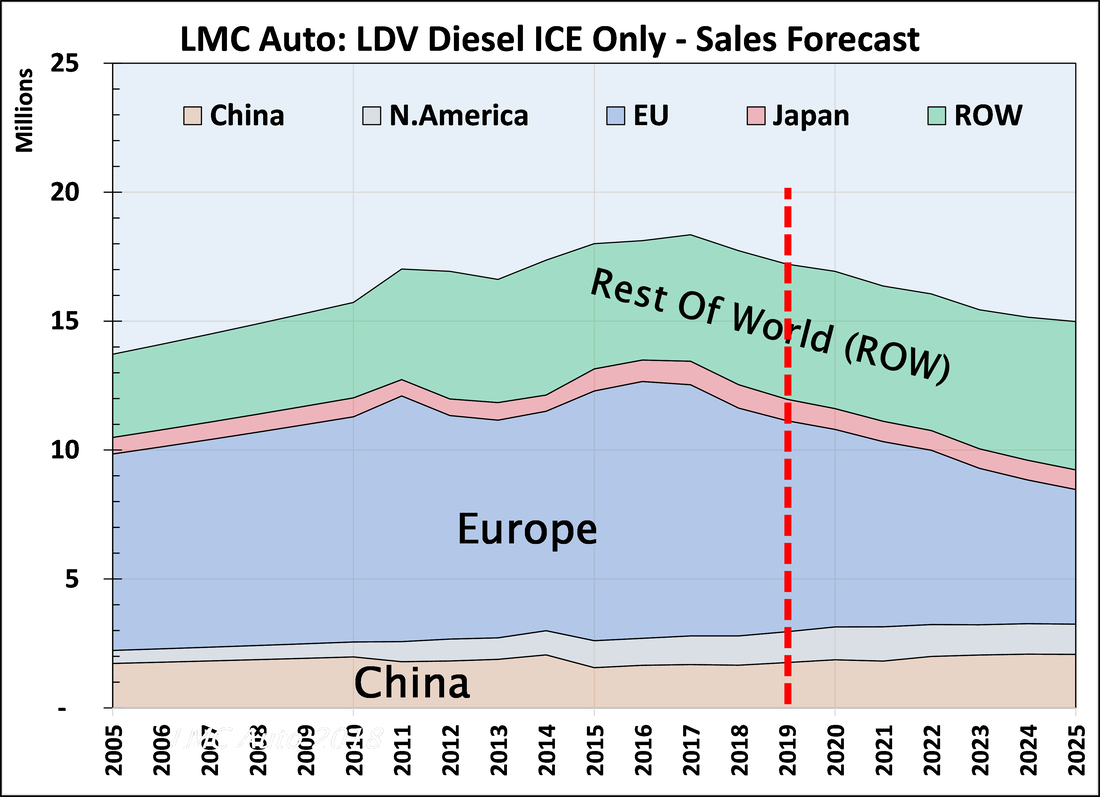 Graph 2: LMC Auto Projected Light Duty Diesel Vehicle Demand Note: The Average LDV Diesel PGM Loadings are Platinum Rich Often 74:22:4 Pt:Pd:Rh Hybrid Vehicles 50-55 MPG for a Toyota Prius Hybrid sells itself. The economics of paying a modest three thousand dollar adder in the up-front price of the car can easily be offset with lower gas prices, especially in expensive gas regions like the EU ($1.52/liter or $5.74 USD/gallon average) and California ($3.65/gallon). It all sounds great for emissions … but wait. It ends up there are unique complexities with a hybrid vehicles emissions. Any car with an engine, gas or diesel, is in a stressful emission condition under what is called a Cold Start. Starting a cold engine is when the emissions are highest. Hybrid vehicles are constantly turning their engines on and off, creating a more stressful condition. Even worse I am told is having a hybrid running under battery that gets to full speed, and then having to convert over to the engine, starting the engine cold at full speed. The new Real World Testing conditions capture this type of event by design. It forces the big auto designers to add more PGM’s to counteract these transient spikes in emissions. The data I have collected from car makers shows hybrid’s PGM loadings 10% higher than a conventional vehicle. The Hybrid revolution is upon us. Again, economically, these vehicles sell themselves in lower operating costs, especially in higher gasoline regions of the world. 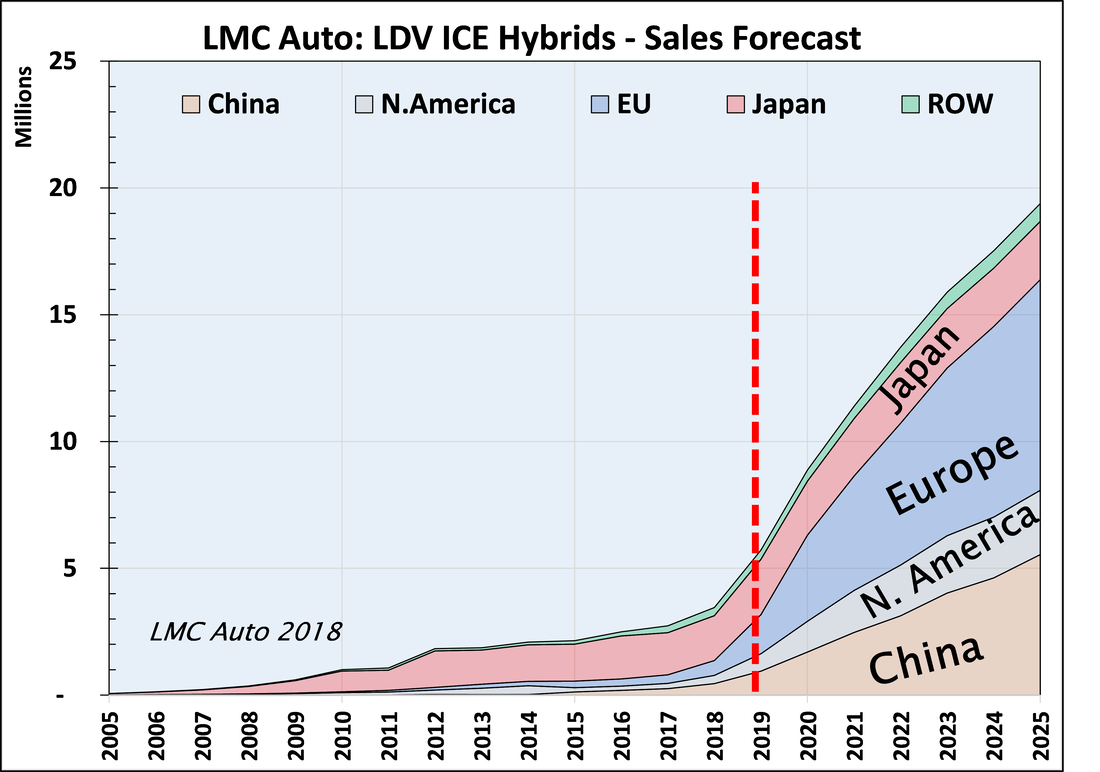 Graph 3: LMC Auto Projected Light Duty Gasoline Hybrid Vehicle Demand Note: The Average LDV Gasoline PGM Loadings are Palladium Rich Long Term Vehicle Global Demand Forecast There is a huge disparity in market analyst views on the global vehicle demand, and its corresponding powertrain mix. The following is a bit of an aggregate of the best available. Several discussion points follow from this slide that are valuable. 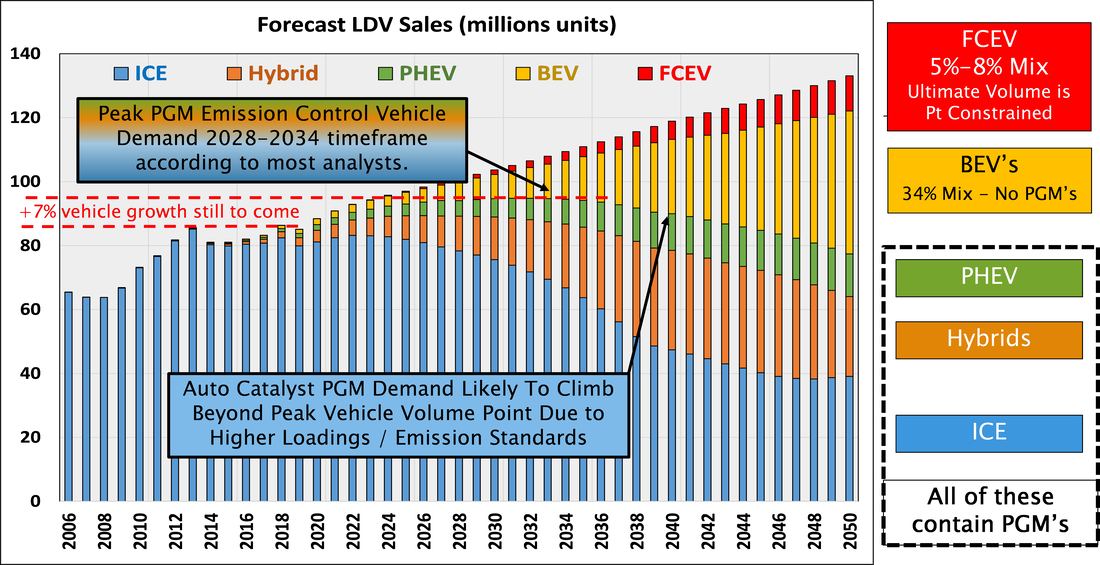 Graph 4: LMC Automotive Actual Global Vehicle Sales Historical Plus Average Forecast Analyst View on Demand Long Term Vehicle Global Demand Forecast – Discussion points 1. ICE Engine Demand Growth: Most near term 10-year forecasts show ICE + Hybrid + PHEV Hybrid demand still growing until ultimately BEV penetration rates fold the PGM containing vehicle demand over. Analyst views that I have seen range between the peak being 2027 to as late as 2032. The amount of the increase over 2018 ranges from 7%-10% additional. 2. BEV penetration is coming: China is leading now in BEV sales. Declining subsidies and incentives are perhaps going to slow this penetration. What strikes me most about this segment is the CO2 footprint in fabricating the Li-Ion batteries. It is not the glorious environmental wonder it’s touted to be. This fact is gaining more traction in multiple forums. Also the impacts to the power grid on not trivial. Power Charging station infrastructure and the global power grid are others topic than needs to be developed to have this conversation. Being a metals guy, conflict minerals, specifically Cobalt 3. Global Vehicle Saturation: In 2018, there are some 1.4 billion vehicles on the road globally. According to this trajectory shown in the table it grows to 2.4 billion. How many vehicles is enough? Vehicle saturation metrics by region show plenty of room for growth in sales, especially in China, S.E. Asia, Russia/Eastern Europe and of course India. How many vehicles represents saturation in each of these markets with varying infrastructure. But really the key in my opinion is the discussion of a Shared Economy. In the USA when I was a young man, I got my driver’s license at 16 years and 1 day. Kids today don’t even care about getting their license. They are far more prone to use Uber or Lift of some other shared service. This is the generational dynamic of the youth of the world will ultimately change this total vehicle ownership model and the corresponding demand trajectory beyond 2030. 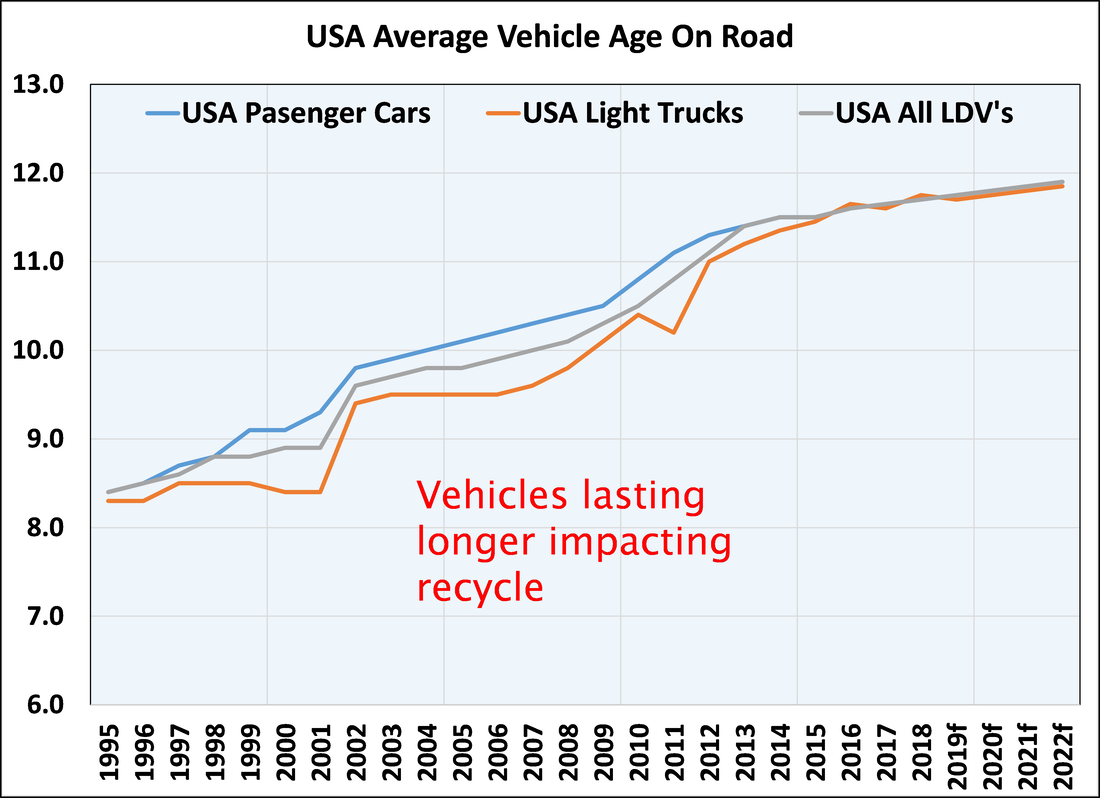 Graph 5: Vehicles per Capita Snapshots In Time 4. Fuel Cell Vehicle Penetration Limits: There is not enough platinum in the world to go too big on LDV. In my analysis, we need it instead for heavy duty and hydrogen generation. Every precious metals analyst in the world agrees that I have talked to. Penetration rates less than 5% with existing global mine infrastructure. 5. Average Vehicle Age is Growing: The average vehicle life continues to grow. This helps reduce new demand, but also delays recycle supply. Graph 6: US Passenger Vehicle on the Road - Average Age Years 6. Regardless of the Zenith in ICE Vehicle Demand, Peak PGM Demand Is Likely Beyond That Point. Regardless of the vehicle count, the emissions standards are likely to push the demand of PGM’s higher, even as BEV’s take a greater market share. PGM Supply Landscape S. Africa’s Bushveld Complex – Key to Minor PGM’s Over 75% of Platinum and 80% Rhodium comes from one region, South Africa, where the world’s largest reserves of PGM’s are found. Only 55% of Palladium comes from S. African with mining growth coming from Russia and N. American where Palladium and some Platinum are a byproduct of Nickel and Chrome mining. We are exceeding our current mined plus recycled supply of Rhodium and Palladium today. Above ground stocks including investment populations like ETF’s (Exchange Traded Funds) have been greatly diminished satisfying current demand. 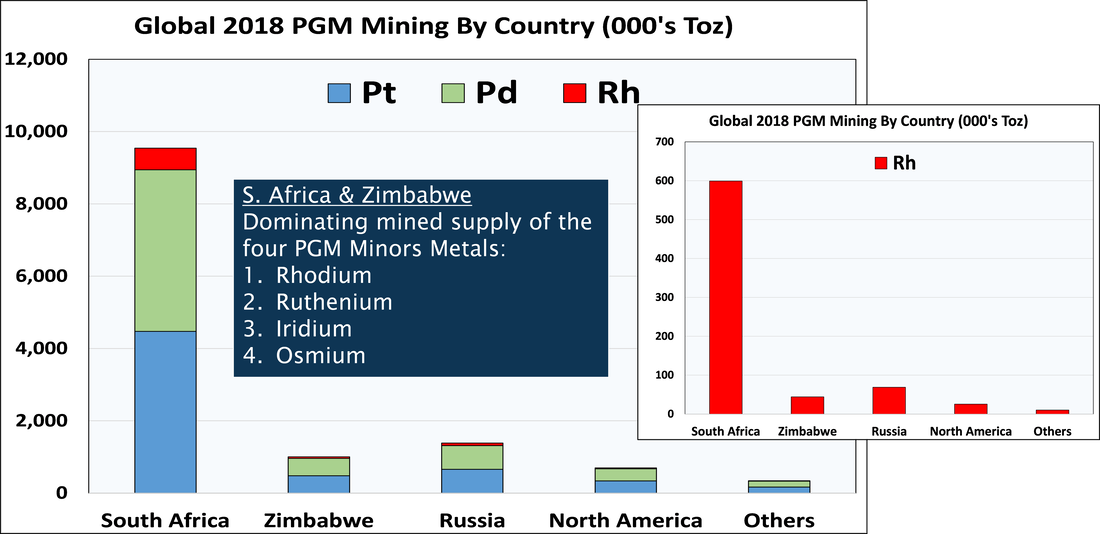 Graph 7: Left: Chart illustrate the S. African mining dominance of the three auto catalyst PGM’s. Right: Focuses on just Rhodium Mining. Unfortunately, some of the world’s first/oldest, and deepest PGM mines in S. Africans Western and Eastern Bushveld Complex are nearing scheduled end-of-life. Planned declines in production are going to hurt minor PGM Metals including Rhodium and Ruthenium over the next 15-years. The below chart are examples from mining companies of what their expected basked output will look like over the next 10-15 years …. declining. 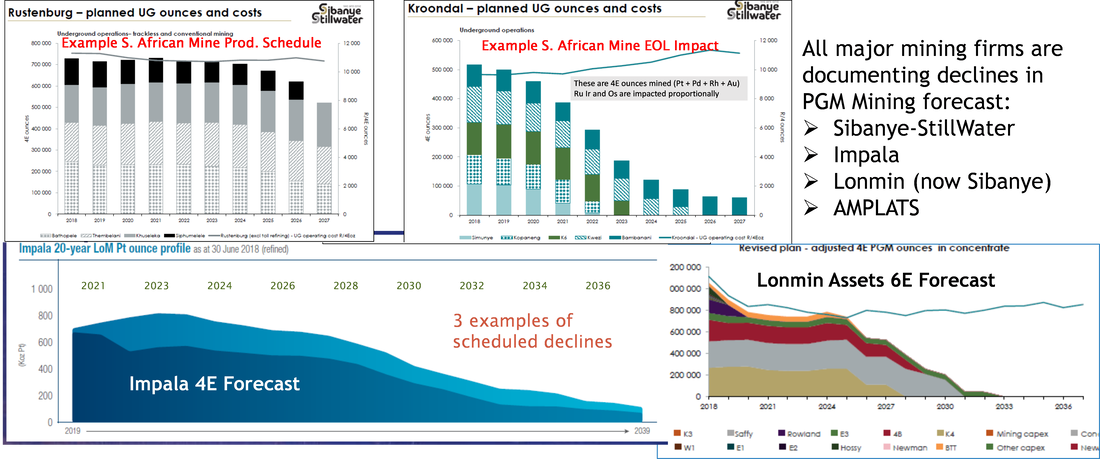 Graph 8: Online Excerpts from Sibanye-Stillwater, Lonmin (now Sibanye-Stillwater), and Impala PGM+Gold Production Outlooks. To make matters worse for everyone, is that the PGM Minor Metals like rhodium and ruthenium are hardest hit by these declines. S. African has three different sets of reefs that are rich in PGM. In the North of S. Africa and extending into neighboring Zimbabwe is the Platreef. On the Western and Eastern sides of this Bushveld Complex are the UG2 and Merensky Reefs at different depths, one after the other. It ends up the UG2 Reef has by far the highest composition of PGM Minor Metals. The Red Stars on the map below are Eastern and Western Limb sites with these scheduled declines. The Green Stars on the map denote the PGM Mining projects in construction, not yet online, but scheduled to launch in the next 5 years. So new mines, but in lower PGM Minor rich zones. 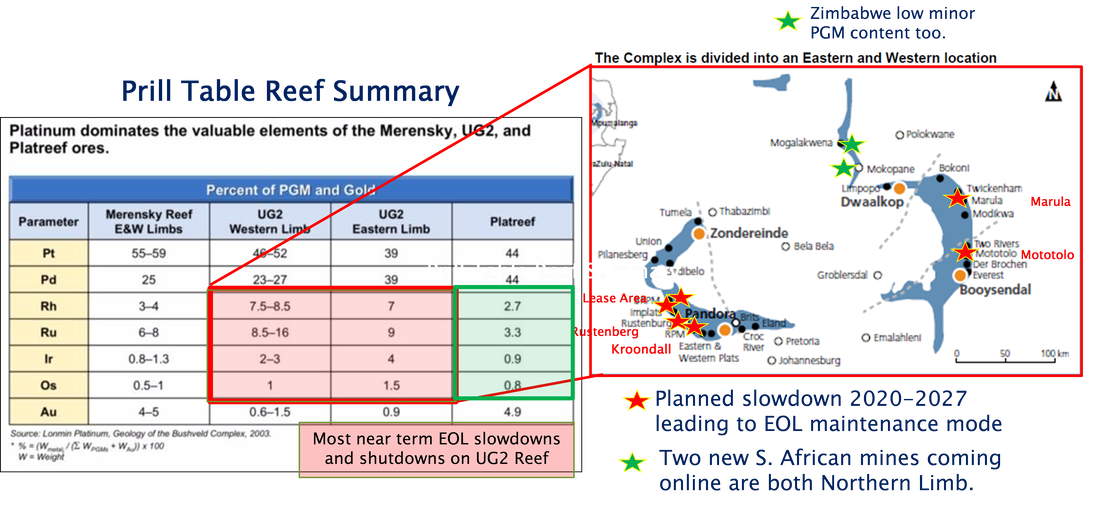 Graph 9: Left: Merensky, UGS and Platreef Prill Table showing average % of each element Right: Map of the Bushveld Complex with color coded sites approaching EOL and New Mines. The PGM Prices since 2016 Rhodium again is used primarily to combat NOX emissions, but it also help with contamination robustness and overall catalytic activity. 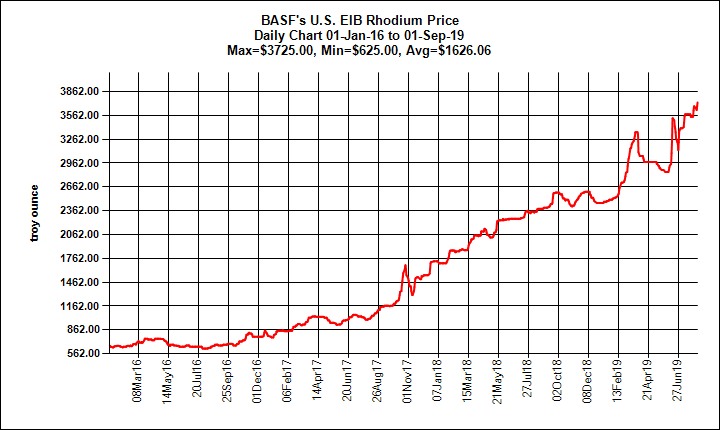 Graph 10: BASF’s USA EIB Fix – Rhodium Fix since January 2016 Was $625/Toz, now nearly $3,600/Toz (~6x increase) Palladium is primary element used on Gasoline engines. 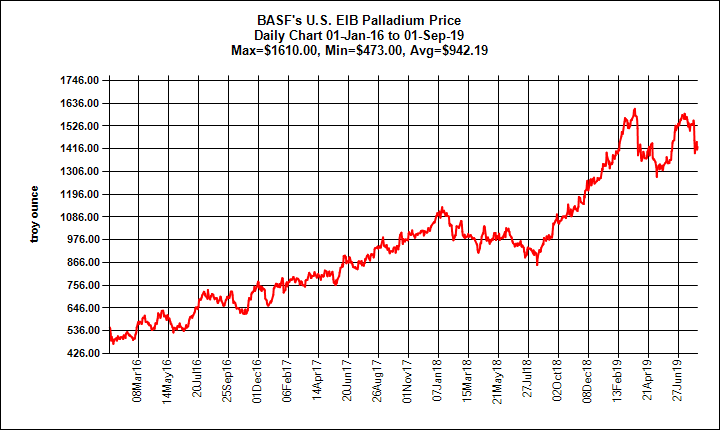 Graph 11: BASF’s USA EIB Fix – Palladium Fix since January 2016 Was $480/Toz, now nearly $1,422/Toz (~3x increase) Platinum is the primary element used in both light duty and heavy duty diesel vehicles catalysts. 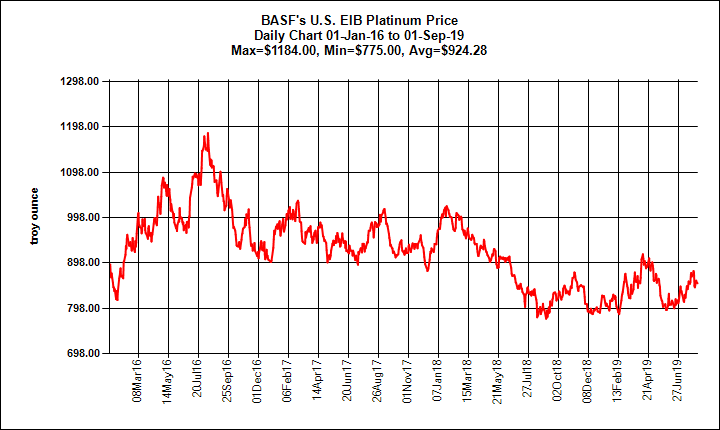 Graph 12: BASF’s USA EIB Fix – Platinum Fix since January 2016 Now $866/Toz Auto Catalyst – The Dominant Demand Segment Today 85% of the Rhodium and Palladium global supply (mined plus recycled) goes into Auto Catalysts, whereas only 37% of the global Platinum supply is used. As a result of increased PGM loadings to meet tightening global emission standards, and increasingly more difficult emission test conditions, prices of Palladium and Rhodium in particular have grown 3x and 6x respectively since Jan 2016. 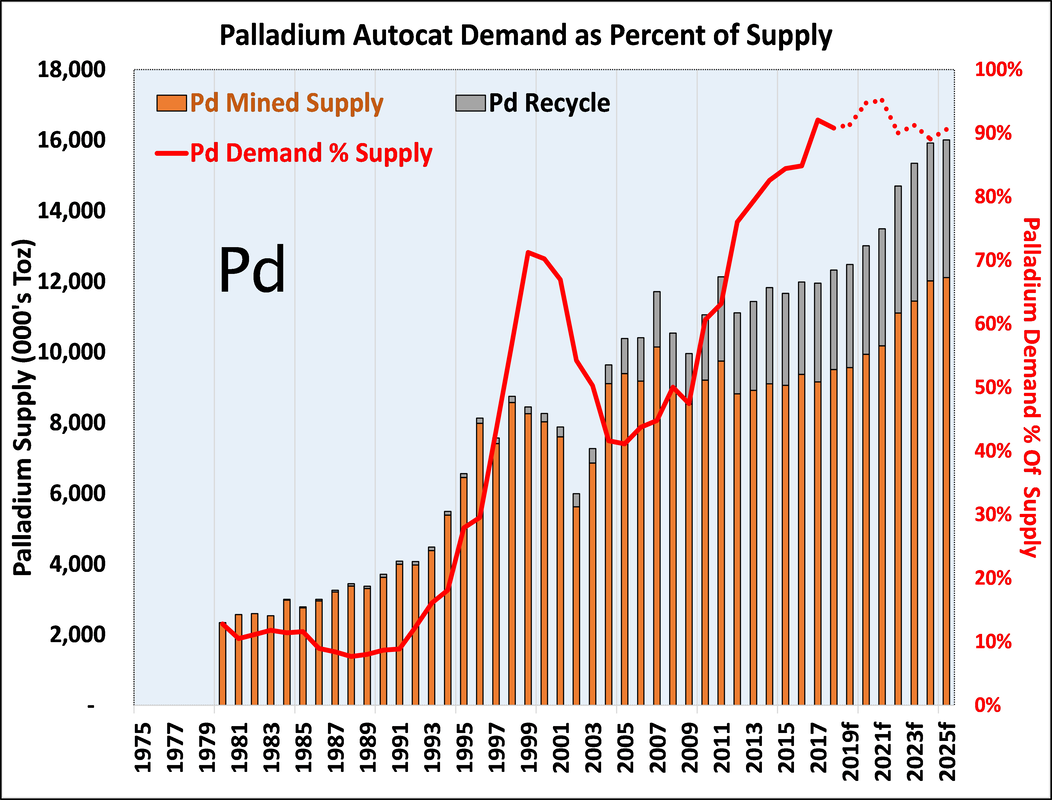 Graph 13: Stacked Bar Chart of Mined + Recycle Palladium Line Chart on right axis is Percent of Palladium Supply that is used in Auto Catalyst 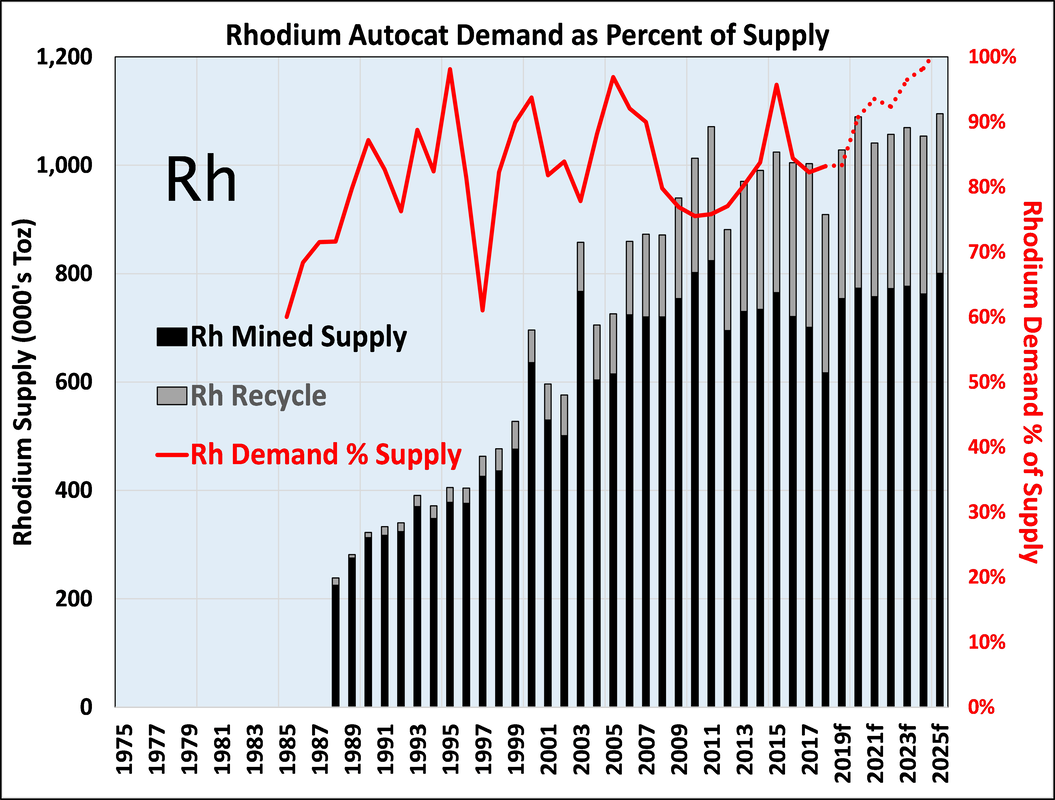 Graph 14: Stacked Bar Chart of Mined + Recycle Rhodium Line Chart on right axis is Percent of Rhodium Supply that is used in Auto Catalyst Extensive Global Auto Catalyst Recycle Eco-System Already In Operation As vehicles are scrapped, global collection networks starting at the vehicle scrap yards collect these PGM containing catalytic converters for recycle processing. Most vehicles today last an average of 15 years. Very high percentages of vehicle catalytic converter precious metals are collected. India is lagging a bit in developing these scrap and recycle eco-system since PGM’s and Auto Catalyst use have lagged penetrating the Indian market compared to the US, EU, and Japan. With more metal, and more complete competitive recycle set of businesses should occur. As can been seen in the following charts, the recycle streams have been key to helping meet the ever growing auto catalyst demand for Palladium and Rhodium. The red line on the right axis expresses the percentage of the metal used just for Auto Catalyst over time. My message: Recycle has been key to connect Supply with Demand. It’s a healthy system, the likes of which we need more of in Solar PV, Li-Ion Batteries, and Electronic Waste streams. Image 1: Left: Picture of scrap catalytic converters, collected in vehicle scrap yards. Right: Image of honeycomb substrate that contains a PGM coated catalyst material. The scrapped Catalytic Converter is cut open (de-canned) and the core is collected, crushed into uniform material, sampled, and analytically assayed to verify PGM containing density, rung across a collection system that further separates the precious metals, then smelted concentrating further, and then final refine taking the compositions to 99.9%+ for reuse. The big discussion at recycle conferences this year has been the impact of Silicon Carbine, primarily from diesel particulate filters. These systems carry a new material into smelting and refine, that simply muck up the process. It slows down processing, forcing systems to be purged and cleaned more frequently. 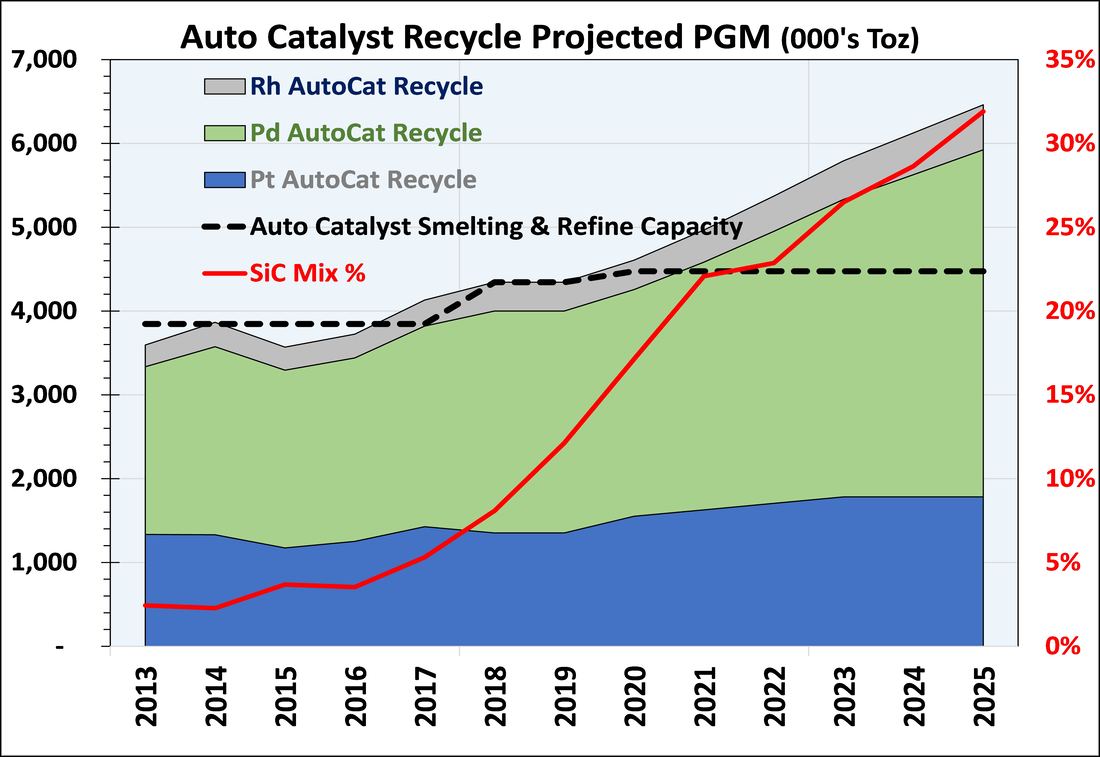 Graph 15: Forecast Auto Catalyst Recycle Demand Vs. Installed Smelting and Refine Capacity Red Line illustrates projected volume mix with SiC increasing from 9% in 2019 to over 30% by 2025. Auto Catalyst Demand Forecast The following illustrates my (Matt’s) modeled projected forecast back in April 2019. The US-china Trade war and subsequent slowdown in vehicle sales has certainly had an impact greater than initially modeled, but overall the trajectory for Palladium Auto Catalyst demand is as follows. My forecast is compared to the other Precious Metal analyst views on same. The most pertinent discussion surround this is the topic of Pt for Pd design swaps. In gasoline engines, you can alter the ratio of Pt:Pd and still get the system to work. The swap may not be a perfect 1:1, but it is possible. It has been done in years past. The complexity currently for the larger Auto OEM’s is that the design emission criteria is now so difficult, and the ICE Engineering resource pool is suddenly smaller. One key complaint from OEM’s is that ICE Engineers are being transferred into BEV and PHEV applications. So fewer Engineering resources, and tougher design targets. The view in multiple conferences is that alternative designs swapping Platinum for Palladium in the ratios, relieving some strain on the stressed Palladium market, will come by model year 2023. 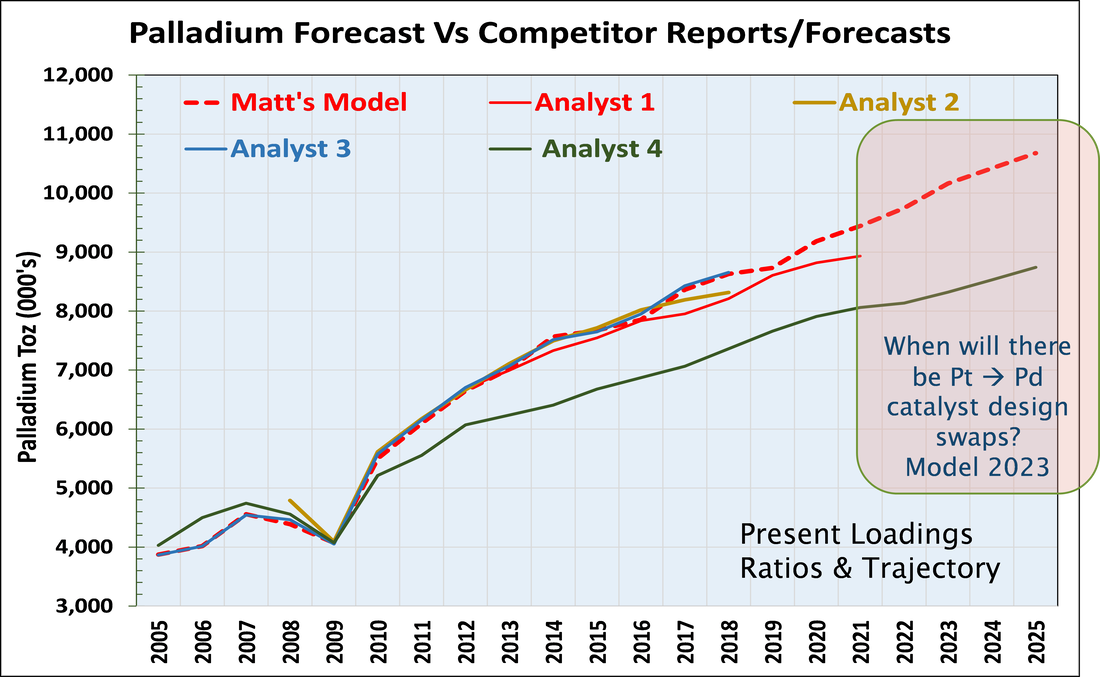 Graph 16: Multiple Analyst Forecasts on Auto Catalyst Palladium Demand Using current nominal design ratios of Pt:Pd:Rh These ratios will change, big OEM’s are working on it. But when? 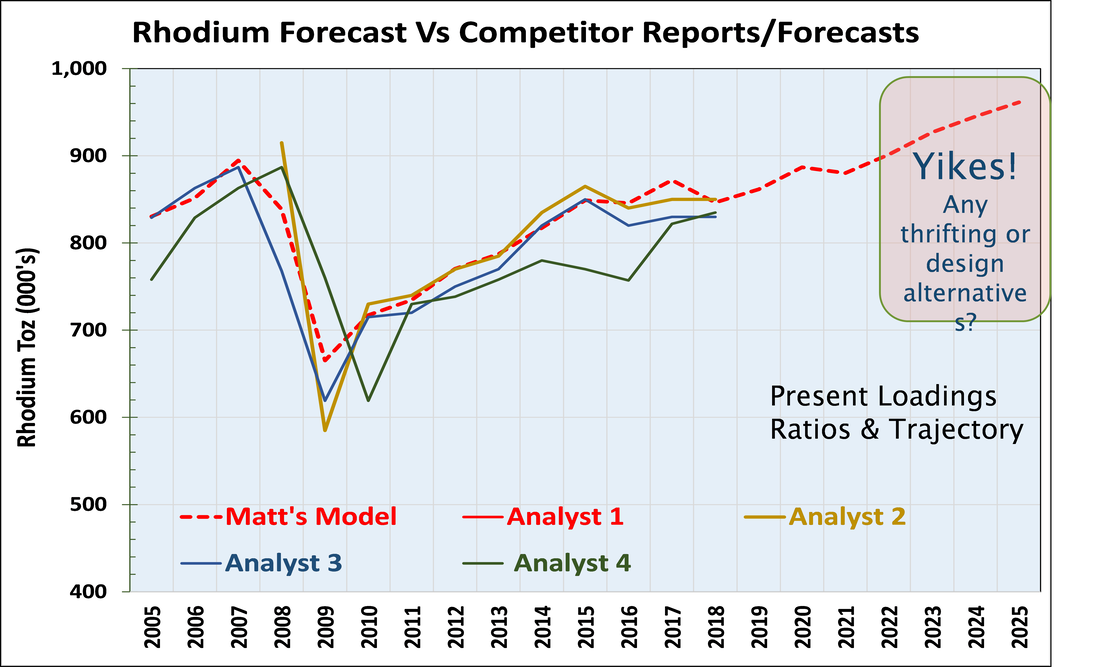 Graph 17: Multiple Analyst Forecasts on Auto Catalyst Rhodium Demand Again no clear design work around for NOX suppression Three Way Catalyst PGM Market Balance So as a result of these modeled PGM demands, it auto catalyst and other applications, the forecast market balance for Palladium and Rhodium look as follows 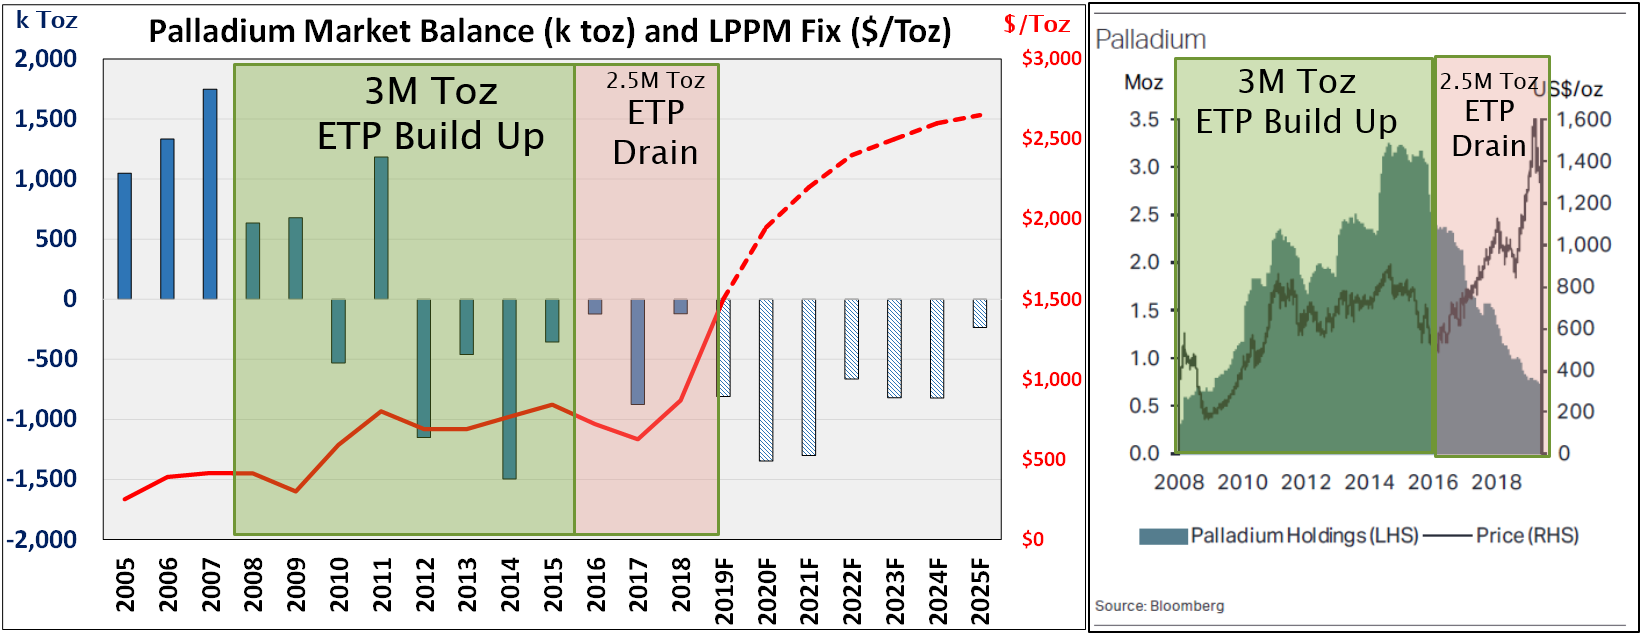 Graph 18: Left: Historical and Forecast Palladium Market Supply vs Demand Balance Structural Palladium Deficit to Continue, Is this Sustainable? Right: Palladium EFF’s – One source of above ground stocks Diminishing above ground stocks 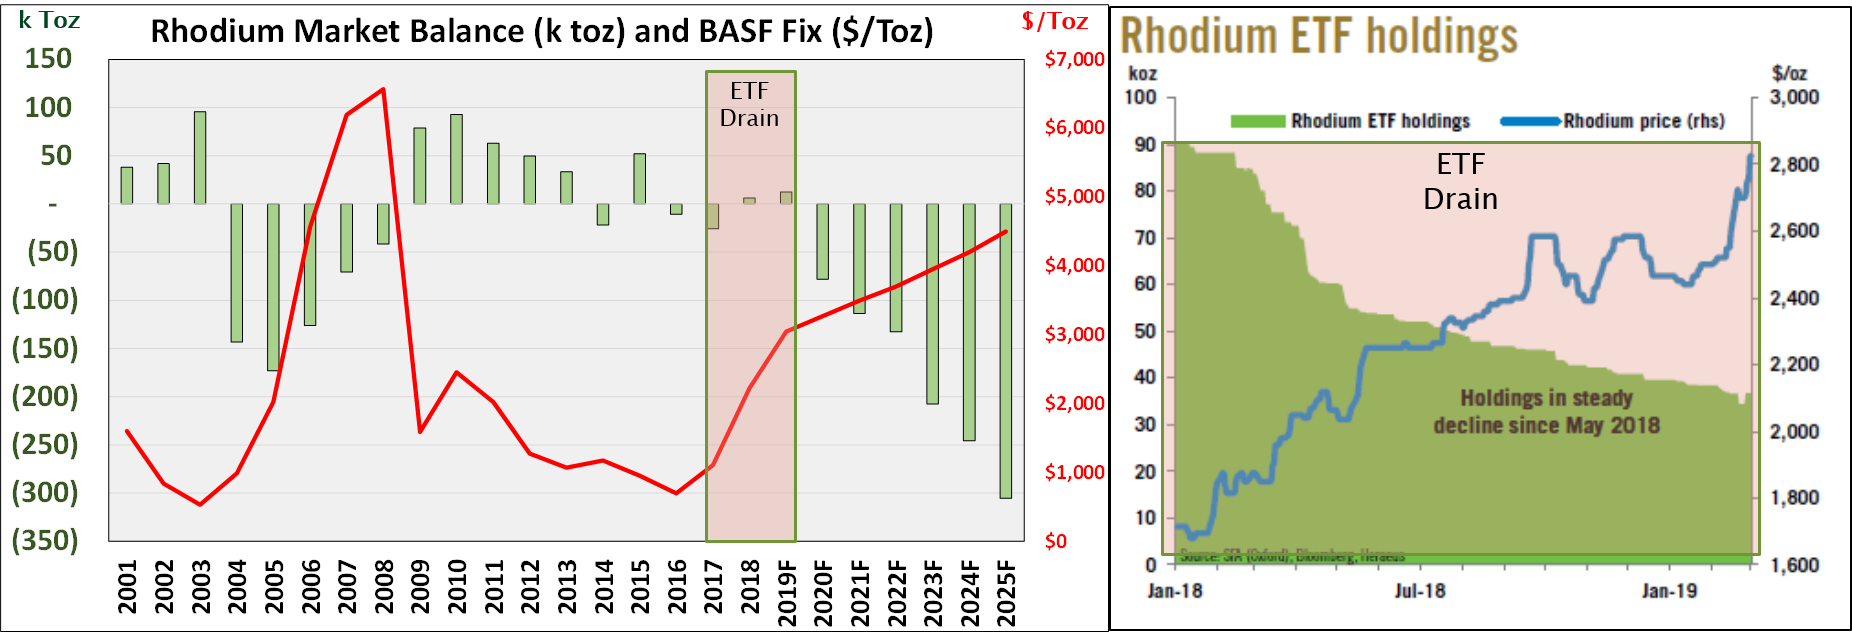 Graph 19: Left: Historical and Forecast Rhodium Market Supply vs Demand Balance Structural Rhodium Deficit to Not Sustainable Right: Rhodium EFF’s - Small and Diminishing above ground stocks Summarizing the Auto Catalyst Precious Metals Dilemma The problem with this situation includes: 1. We are just getting started. The global shortage is going to get worse through 2023. The PGM demands will only grow, even if global vehicle demand stays flat. Emission are getting tighter and tighter. 2. Testing Conditions, like the RDE, are only going to propagate into additional regions. Just now they are rolling out in China and the EU. 3. Rhodium today is essential for NOX reduction. Design work arounds do exits, but at some multiples in cost. 4. Thank Goodness For The Global Economic Slowdown. Strange saying that, but in terms of PGM demand, it would be substantially worse right now if not for the slowdown. This too in time will be resolved and the macro-economic condition should ultimately improve. 5. Global Auto-Catalyst PGM Recycling for over a decade has been key to connect supply with demand. Starting about a year ago, we are hitting global Smelting and Refining capacity limits. More capacity is needed in the US, EU and Japan. All of the major refiners at full capacity. 6. Silicon Carbide (SiC) from substrates and Diesel Particulate Filters, and other hard to process materials, now entering the auto catalyst recycle stream is mucking up the smelting and refining operations, effectively lowering global capacity dealing with this difficult to process materials. 2019 is estimated to have 9% of the auto-scrap population with SiC. That is projected to grow to 30% of the mix within 5 years. 7. BEV Penetration is too slow, and has its own global problems.
8. ICE Engine Vehicle Demand requiring catalytic converters is projected to have roughly 7-10% additional growth upside over the next decade, before BEV penetration rate turns the ICE vehicle demand curve over. 9. Fuel Cell Vehicles penetration is limited by the available global supply of platinum. Light duty penetration rates would be small even with aggressive propagation initiatives.
10. Big Auto OEM efforts to modify the gasoline three-way catalyst design ratio’s have been hampered to date. The best outlook on an intercept of a more Platinum rich gasoline engine design is Model 2023 (build volumes starting ~August 2022). 11. Tightening global emission standards every year. 12. More complex Real World Emission Test protocols. 13. Reduction in Palladium rich diesel vehicle demand. 14. Increase in Palladium rich gasoline vehicle demand. 15. Increase in Palladium rich PGM loadings with increased Hybrid vehicle demand. 16. Depleted above ground Palladium ETF stocks. Investment bullion populations do exist beyond just ETF physical positions. 17. Palladium Structural Supply versus Demand Deficit is going to be stressed further through 2023. Can it sustain this additional strain? I personally question if we have that long. All PGM Mining sites globally are pushing production recently as PGM basket prices have risen, but is a 2% global surge enough? 18. Small Rhodium ETF position is nearly fully depleted, and small speculative physical position in the Minor PGM. 19. Rhodium Structural Supply versus Demand Deficit is a broken situation. Something has to give. 20. Macro-Economic recovery will come, it is just a matter of time. Where Do We Go From Here? Big auto OEM’s do have the ability to influence design loadings to some degree though additional optimization efforts on the ICE alone. The greater the optimization of the bare engine, the less work strain put on the catalytic converter to capture and manage transient spikes in emissions. Honda for example has historically been very good at this. However, this is a costly and manpower intensive approach, and of course this would add cost to the vehicle. Current OEM’s are streamlining Engineering resources on the ICE powertrain, in favor on new emerging BEV, PHEV, and FCEV development efforts. Triggering more platinum mining will be needed to grow fuel cells and the hydrogen economy. Simply put we need more platinum starting in about 15-20 years to meet a large slope of PEM Fuel Cell Demand. We are in time to trigger these additions. However, we are too late to trigger expansions (not already triggered) in the existing PGM pipeline for new mines to satisfy Auto Catalyst demand. Again it is nominally a 10-15 year funding to production timeline, so it is already too late. The next best option is to push for incremental output gains from existing mining resources to get more quicker from assets already in place through incremental expansion of existing infrastructure. Regulation Caps. The only other level to be pulled is to push back on governments and regulators insisting tightened emission controls. Recycle Capacity Additions. More capacity has recently come online in India and China. Although not large recycle volumes are available in those regions yet, recyclers will need to consider shifting excess weight from other regions into these new smelting and refine operations to help meet global demand. Also new factory additions are needed. Smelting and Refine Technology Optimization. SiC is indeed mucking up today’s typical collector, smelter and refine process. Umicore is one exception touting an oxidation furnace approach that is far more robust to SiC and other next generation difficult to process material sets. The next IPMI technical conference will make this a main theme of discussion for the recycle community. It is not clear to me that all of these countermeasure in concert will be enough. On Rhodium, we are almost certainly going to hit a limit, and soon. On Palladium it is not clear we have until 2023 model year to intercept a higher platinum rich gasoline design. Big Auto will need to take action sooner, especially if the global economy accelerates.
4 Comments
8/14/2020 12:22:06 am
This blog is very helpful and informative for everyone. I just like this blog. thanks for share with us.
Joely
4/22/2021 11:51:06 am
I have some for sale in Bulgaria 0887027593
Alankaye
4/15/2021 03:36:56 am
Wow
asa ziv
8/17/2022 06:54:27 am
what is the price of 1 kg of recycled palladium vs. new one? Leave a Reply. |
Author
Matt Watson, Precious Metals Commodity Management LLC Archives
November 2020
Categories |


 RSS Feed